


Berkeley Researcher Applies Graph Theory to Biofuels Research
September 4, 2013
Adapted from a story published in ASCR Discovery.
Aydin Buluc
Energy scientists hope new plant varieties will yield large amounts of biomaterial, which new types of microbes will quickly and cheaply convert into clean-burning fuel. To achieve these goals, researchers will need novel algorithms that enable supercomputers to sift through the combined genomes of several hundred plants or microbes in search of useful genes.
Aydın Buluç a computational research scientist in Lawrence Berkeley National Laboratory’s Computational Research Division, will use support from a Department of Energy Early Career Award to develop faster and more energy-efficient data-mining algorithms than now available in the quest for new biofuels. (The dotless i in Buluç’s first name springs from the alphabet used in his native Turkey, as does the c-cedilla in his last name.)
The challenge and promise of new algorithms have the same root: graph theory. The theory’s tenets as an abstract way to think about information are tried, true and, in computational sciences, ubiquitous. Each data point is represented by a vertex, and each relationship, if any, between vertices is represented by a line, or edge. Assigning different weights to different edges to represent distances between markers lets a programmer create a network representing all markers and the distances between them. Then the analysis begins.
The World Wide Web is a familiar graph. Each page is a vertex and each link is an edge. Road maps also are graphs – ones analyzed many times a day. Each time someone asks Google, MapQuest, Yahoo! Maps or a similar website for driving directions, the server performs a point-to-point shortest-path query – a graph algorithm.
“Graphs are a great way to represent data,” Buluç says. “For example, in genetic mapping, you have lots of polymorphisms (genetic variations) within a species that act as genetic markers. You need to find the locations of these markers in the genome to build a scaffold that guides the whole-genome assembly. How do you order the markers? You use a graph algorithm.”

A graph of DOE Early Career Award recipient Aydın Buluç’s LinkedIn connections, an example of graph clustering. Buluç likes the illustration because the different clusters are color-coded. Graph clustering is a fundamental problem in data mining, he says. Image courtesy of Aydın Buluç, Lawrence Berkeley National Laboratory.
Graph theory lets computers do wonderful things, but graphs have disadvantages. An algorithm’s progress through a graph is like a treasure hunt. The algorithm starts at one vertex and traverses the edges from one vertex to the next. It never sees the whole graph and never sees more than one step ahead. Instead, it discovers each next destination only after it has arrived at the latest vertex and finished the task at hand. Then the algorithm proceeds to the next vertex, even though it may be – and often is – the most costly step to take.
This myopic approach to running an algorithm works beautifully on a personal computer. With only one or two central processing units, or nodes, sitting next to each other, all data are on a nearby drive or in active memory. The computer spends virtually all of its time and energy calculating.
However, when multiple nodes are combined to handle large amounts of data and work in parallel, the system spends more time and energy moving information from wherever it’s been stored to wherever it’s needed. And since the graph has no simple overarching structure, those locations are as likely to be on opposite sides of the system as they are to be nearby.
“Graph algorithms spend a lot of joules (units of energy) per useful work because of their poor locality of reference,” Buluç says. “If the data is not in the cache, you will have to access it, and the farther you have to go to access the data, the more joules you will have to spend.”
According to Buluc, an application based on conventional graph algorithm might spend 60 percent of its time communicating and only 40 percent on calculations at 250 nodes. Above 4,000 nodes, the time spent doing calculations is just over 20 percent. The rest is all data transfer. The cost of that communication is enormous. The electric bill to run a supercomputer for a decade can cost more than $3 million a year, depending on size and type of system.
To boost computers’ efficiency at navigating the system, Buluç is developing tools based on his doctoral work with John R. Gilbert, professor of computer science and director of the Combinatorial Scientific Computing Laboratory at the University of California, Santa Barbara. The use of matrices to represent graphs is a centerpiece of many projects in Gilbert’s lab and also is a key to Buluç’s work.
The idea is to plot the vertices of a graph against each other and place symbols in spaces within the matrix to represent relationships between the vertices.
“We know a lot about matrices,” Buluç says. There are decades of computational science research on matrices but a relative lack of tools suited to work with graphs. Once a graph is represented as a matrix, additional tools become available to analyze the graph. “Not all of the tools are there, but it gives you more intuition and ideas.”
In fact, Gilbert explains, a more familiar scenario would be to reverse the procedure and represent matrices as graphs. For decades, graph algorithms have been used to solve large matrix computations, without much regard to the energy costs. “What’s happened in the past 10 to a dozen years is that people working in large-scale supercomputing have turned to using graphs for their own sake.”
Turning the tables on graphs
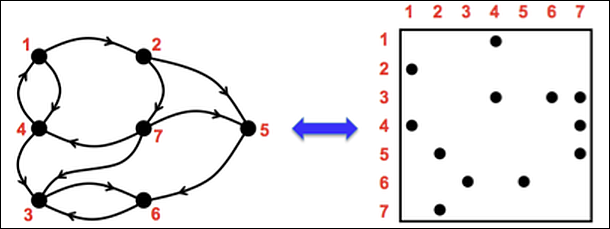
To represent a graph (left) as a matrix (right), researchers arrange the vertices across the top and down the left side of a matrix. The symbols placed within the matrix represent the edges that connect the vertices to one another. The matrix representation makes more tools available to analyze the graph. Image courtesy of John Gilbert, University of California, Santa Barbara.
Graphs are especially powerful for analyzing networks, which have become important in finance, genomics and, of course, the Internet. As a result, Gilbert’s lab and other groups have turned the tables, retooling techniques that employed graphs to solve matrix problems into new techniques that use matrices to solve graph problems.
“So matrix computation is returning the favor to graph theory,” Gilbert says.
In his new endeavors, Buluç intends to take particular advantage of time-honored shortest-path algorithms and the ability to divide and conquer a large graph, using its matrix to group vertices into clusters.
These time- and energy-saving techniques could, of course, be used in many more applications than genomics. Climate modeling, ecology, chemistry, astrophysics and many other disciplines face challenges that the use of matrices to analyze large graphs could help surmount.
Gilbert credits Buluç with taking the use of matrices to a new level in solving graph problems. Buluç developed some of the first basic architectural pieces, some fundamental algorithms, a design for executing the techniques with the extra complications of distributed memory systems, and even the beginnings of a library of programs.
“The vision of using [matrices] to do graph algorithms existed,” Gilbert says. “What Aydın did was to make it large-scale, scalable, and industrial strength.”
“A matrix makes operations faster, scalable, and more energy-efficient,” Buluç says. “It lets you take something that would have taken you a couple of days, and it lets you do it in an hour. But that’s what computer science is all about, right? Doing things faster.”
About Berkeley Lab
Founded in 1931 on the belief that the biggest scientific challenges are best addressed by teams, Lawrence Berkeley National Laboratory and its scientists have been recognized with 16 Nobel Prizes. Today, Berkeley Lab researchers develop sustainable energy and environmental solutions, create useful new materials, advance the frontiers of computing, and probe the mysteries of life, matter, and the universe. Scientists from around the world rely on the Lab’s facilities for their own discovery science. Berkeley Lab is a multiprogram national laboratory, managed by the University of California for the U.S. Department of Energy’s Office of Science.
DOE’s Office of Science is the single largest supporter of basic research in the physical sciences in the United States, and is working to address some of the most pressing challenges of our time. For more information, please visit energy.gov/science.