


A Better Way to ID Extreme Weather Events in Climate Models
Berkeley Lab scientists help automate the search for hurricanes and other storms in huge datasets
December 7, 2011
, dakrotz@lbl.gov, +1 510-486-4019
You’d think that spotting a category 5 hurricane would never be difficult. But when the hurricane is in a global climate model that spans several decades, it becomes a fleeting wisp among mountains of data.
That’s a problem. As scientists develop ever-more sophisticated computer models to predict the effects of climate change, one of the things they’ll look for are changes in the frequency of extreme weather events such as hurricanes and heavy precipitation. The more data generated by models, however, the more difficult it is to quantify these rare but potent events.
What’s needed is an automated way to quickly comb through a climate simulation’s huge dataset and tally the weather events that spell big trouble. A team of researchers that includes scientists from Lawrence Berkeley National Laboratory (Berkeley Lab) are developing techniques to do just that.
“We’re using state-of-the-art methods in data mining and high performance computing to locate and quantify extreme weather phenomena in the very large datasets generated by today’s climate models,” says Prabhat, a scientific visualization expert in Berkeley Lab’s Computational Research Division. “We want to help answer the question: How will climate change impact the frequency of extreme weather?”
The research is led by fellow Berkeley Lab scientists Wes Bethel, Bill Collins and Michael Wehner, and includes scientists from Oak Ridge National Laboratory, Los Alamos National Laboratory, Lawrence Livermore National Laboratory, and the University of California at Berkeley. Prabhat is presenting examples of their work Thursday morning (Dec. 8) at the annual meeting of the American Geophysical Union in San Francisco (8:30 a.m., room 102).
In one example, the scientists began with a recent run of the Community Atmospheric Model (CAM5), which is the latest in a series of global atmosphere models developed primarily at the National Center for Atmospheric Research. The high-resolution simulation spanned from 1979 to 2005 and is being used to demonstrate how well the model reproduces observed tropical cyclones. It was conducted on Hopper, a Cray XE6 supercomputer at the National Energy Research Scientific Computing Center (NERSC), which is located at Berkeley Lab.
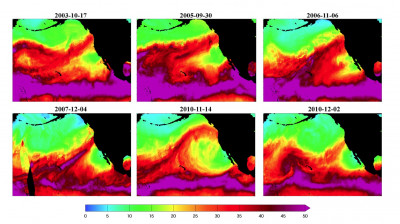
Some typical atmospheric river events detected by the new method from the observational dataset. Shown is total column integrated precipitable water in millimeters. Note that data irregularities in the satellite measurements (such as the abrupt discontinuities in the 2007-12-04 event) do not have an adverse effect on the detection procedure.
The 27-year simulation generated 100 terabytes of data. In comparison, as of September 2011, the Library of Congress has collected about 254 terabytes of data.
To detect the hurricanes and cyclones in this simulation, the scientists used code from a model that tracks the intensity of hurricanes and cyclones, and adapted it to run in parallel on large datasets. In this case, the technique churned through the CAM5 simulation in two hours using 7000 cores at NERSC. It successfully quantified the hurricanes that appear in the simulation. The same process would have taken 583 days on a conventional desktop computer.
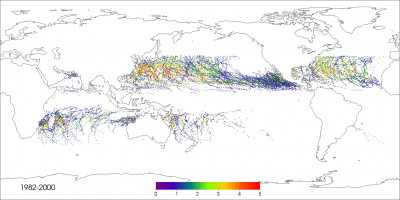
In another example, the scientists developed a pattern-detection algorithm that sifts through large datasets for a weather phenomenon called an atmospheric river. These are narrow corridors of water vapor that occur at mid-latitudes around the world. People who live on the Pacific coast of North America may know the phenomenon as a pineapple express, which channels moisture from the Hawaiian Islands to the west coast. These powerful storms can bring torrential rain, floods, and damaging wind.
The scientists used techniques from image processing and topological analysis to extract the telltale features of atmospheric rivers from satellite images and climate models. They then implemented these techniques in a massively parallel fashion on a supercomputer platform to automatically detect these events in large datasets.
They applied this software to satellite images from 2002 to 2010 and atmospheric modeling data from 1979 to 1993, representing 640 gigabytes of data in all. The software processed this data in about three seconds using 8500 cores on the NERSC Hopper system, and detected 92 percent of the atmospheric rivers that made landfall. The same process would have taken several hours on a conventional desktop computer.
About Berkeley Lab
Founded in 1931 on the belief that the biggest scientific challenges are best addressed by teams, Lawrence Berkeley National Laboratory and its scientists have been recognized with 16 Nobel Prizes. Today, Berkeley Lab researchers develop sustainable energy and environmental solutions, create useful new materials, advance the frontiers of computing, and probe the mysteries of life, matter, and the universe. Scientists from around the world rely on the Lab’s facilities for their own discovery science. Berkeley Lab is a multiprogram national laboratory, managed by the University of California for the U.S. Department of Energy’s Office of Science.
DOE’s Office of Science is the single largest supporter of basic research in the physical sciences in the United States, and is working to address some of the most pressing challenges of our time. For more information, please visit energy.gov/science.