


MetroMaps: Map-based Representations for Analyzing Optimization Solution Spaces
Problem Statement and Goals
Understanding the solution space plays an important role in a wide range of optimization applications. For example, finding solutions to many urgent problems (e.g., pollution and global warning) requires novel insights into chemical systems and processes. It is possible to gain these insights through computational modeling and analysis of the system. One characteristic, common in the analysis of many existing models, is the energy function of coordinates of components of a chemical system. Analyzing this energy function (a specific instance of a cost function in optimization problems), defined on a high-dimensional domain, may improve our understanding of chemical systems and reactions.
There is a lack of effective visualization techniques for these multi-dimensional functions, and chemists often study only one or two parameters of interest at a time. Developing a comprehensive understanding of these complex systems requires new visualization techniques that show relationships between all parameters describing the system at the same time.
Implementation and Results

Figure 1: A 2D graph showing the topology of the 3D potential energy function of a complex of formic and acetic acids, which depends on the positions of constituting atoms. The strength of this approach is that it shows an entire high-dimensional energy landscape in terms of stable states and transitions between them, which are concepts familiar to chemists.Figure 1 shows a graph of the topology of the 3D potential energy function of a complex of formic and acetic acids, which depends on the positions of constituting atoms. Each sample in this energy function corresponds to a simulation run for a particular configuration of the system. Blue and red dots represent minimum energy configurations and lowest barriers connecting neighboring minima, respectively. Edges represent the energy cost of a particular transformation, with darker and wider edges corresponding to transformations through lower barriers (more likely transformations). Two vertical branches corresponding to different positions of protons are visible on the left and right side of the graph. Energy barriers for transforming the right branch into the left one are lower than for the reverse transformation.
Our approach utilizes the fact that the Morse complex contains the information required to understand state transitions in these systems. Each stable state of the chemical system corresponds to a minimum in the energy function. The Morse complex partitions the domain into regions such that following the gradient from any point in the region will end at the minimum. For an energy function these segmented regions correspond to classes of configurations associated with a stable state. Each descending region can adjoin several other regions. The lowest function value along the boundaries between two adjoining regions, also called the saddle, corresponds to the barrier between the states. Since minima and saddles in the Morse complex correspond to energy minima and barriers, chemical transformation paths are given by the edges connecting two minima through a saddle. Assigning minima and saddles to nodes and connecting pathways as edges creates the Morse complex graph.
However, since the graph itself is an abstract structure, we have to find a proper layout to visualize it. Although standard graph-layout algorithms may produce visually pleasing visualizations of the Morse complex graph, this representation does not consider relational information from the original system, which is important for chemical analysis due to the impact of distances on the probability of certain transformations. To preserve this relational context, we project the high-dimensional point locations of the graph onto the plane using principal component analysis (PCA).
Once we have obtained final positions for all nodes of the graph, we add chemical information from the model system. Since the most important information is the energy difference between a minimum and a barrier, we color edges according to the energy difference value. The Boltzmann distribution states that the probability of accessing a state decreases exponentially with its energy. The lower the energy difference is, the higher the probability of a transformation. Hence, we display paths with smaller energy differences more prominently (darker colors and wider edges). Periodic edges, i.e., edges crossing a boundary along which the problem is periodic, are dashed, and the common saddle of the two connected minima is broken into two nodes (see Figure 1. Finally, we add labels to all minima that specify coordinates (first line) and energy values (second line).
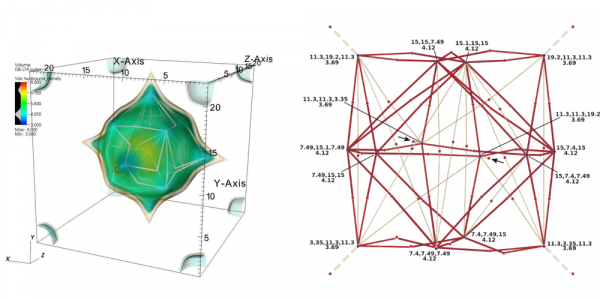
Figure 2: (Left) Volume rendering of the energy function of a CH4 molecule in an LTA zeolite and lowest energy paths connecting neighboring minima. (Right) The corresponding graph shows the lowest energy paths (an edge going through a face of the periodic box marked with arrows).
The free energy function of CH4 in an LTA zeolite is substantially different from the energy functions of the dimer of formic acid and acetic acid, see Figure 2 (left) and (right). This graph represents only the large cage of LTA zeolite, which is the only fragment of void space in LTA accessible to CH4. The graph representation of the free energy reveals important information about the material. There are 14 important energy minima per periodic unit cell of LTA corresponding to favorable locations of the adsorbing CH4 molecule (adsorption sites). Six of them correspond to lower energy (ca. 3.7 kBT), and are localized near windows connecting two periodic cells (near faces of the unit cell). The remaining eight minima are localized further away from the windows, on the surface of the large cage of LTA. The further analysis of connections between nodes/minima in our representations reveals that all 14 minima localized within the big cage are separated by low barriers, and therefore movements of the CH4 molecule between the adsorption sites are feasible. However, connections between large cages in the extended material lead through high barriers. These high barriers along diffusion paths in every direction are reflected in slower diffusion rates.

Figure 3: Graph of the 4D energy function of DFA. Nodes are labeled A1 to A9 and B1 to B6 to highlight two subgraphs. A1--A9 correspond to minima with coordinates of 0.95Å along the first and second dimension. The remaining third and fourth coordinates are (45,345), (180,345), (60,180), (285,345), (180,180), (60,0), (300,180), (180,0), and (300,0) for A1 to A9, respectively. Similarly, the first and second coordinate for B1--B6 are 1.75Å. The remaining coordinates are (60,345), (180,345), (300,345), (60,0), (180,0), (300,0) for B1 to B6, respectively.
The final example is the graph representation of the 4D energy function of DFA depicted in Figure 3, for which plotting the original energy functions in all four dimensions was not feasible. The resulting graph is fairly easy to analyze. It clearly shows energy separation of the graph into two subgraphs: one corresponding to rotamers of DFA (with minima denoted A1–A9) and another with double proton transfer (minima denoted B1–B6). Transitions between minima within each subgraph are at low cost, as shown by heavy edges.
Impact
Our approach holds promise in allowing chemists to gain insight into complex chemical systems and understand higher dimensional energy functions. Since topological features of the Morse Complex correspond directly to concepts such as stable states, it provides an intuitive overview of a chemical system. In the long term, it will allow chemists to analyze higher dimensional systems all at once without having to look at pairs of parameters separately (see Figure 3 for a four-dimensional example). We also plan to adapt this representation to other optimization problems, such as providing an overview over the solution space in the auto-tuning of codes for high-performance architectures.
Contact
Maciej Haranczyk, Gunther H. Weber
Collaborators
Kenes Beketayev (UC Davis), Peer-Timo Bremer (LLNL), Bernd Hamann (UC Davis), MarioHlawitschka (University of Leipzig).
References
Kenes Beketayev, Gunther H. Weber, Maciej Haranczyk, Peer-Timo Bremer, Mario Hlawitschka, and Bernd Hamann. Visualization of topology of transformation pathways in complex chemical systems. Computer Graphics Forum (Special Issue, Proceedings Eurographics/IEEE Symposium on Visualization), pages 663–672, May/June 2011. LBNL-5019E.
About Berkeley Lab
Founded in 1931 on the belief that the biggest scientific challenges are best addressed by teams, Lawrence Berkeley National Laboratory and its scientists have been recognized with 16 Nobel Prizes. Today, Berkeley Lab researchers develop sustainable energy and environmental solutions, create useful new materials, advance the frontiers of computing, and probe the mysteries of life, matter, and the universe. Scientists from around the world rely on the Lab’s facilities for their own discovery science. Berkeley Lab is a multiprogram national laboratory, managed by the University of California for the U.S. Department of Energy’s Office of Science.
DOE’s Office of Science is the single largest supporter of basic research in the physical sciences in the United States, and is working to address some of the most pressing challenges of our time. For more information, please visit energy.gov/science.