


Catching Turbulence in the Solar Wind
Berkeley Lab visualizations could help scientists forecast destructive space weather
December 16, 2013
Linda Vu, +1 510 495 2402, lvu@lbl.gov

This visualization zooms in on current sheets revealing the “cascade of turbulence” in the solar wind occurring down to electron scales. This is a phenomenon common in fluid dynamics—turbulent energy injected at large eddies is transported to successively smaller scales until it is dissipated as heat. (Image by Burlen Loring, Berkeley Lab)
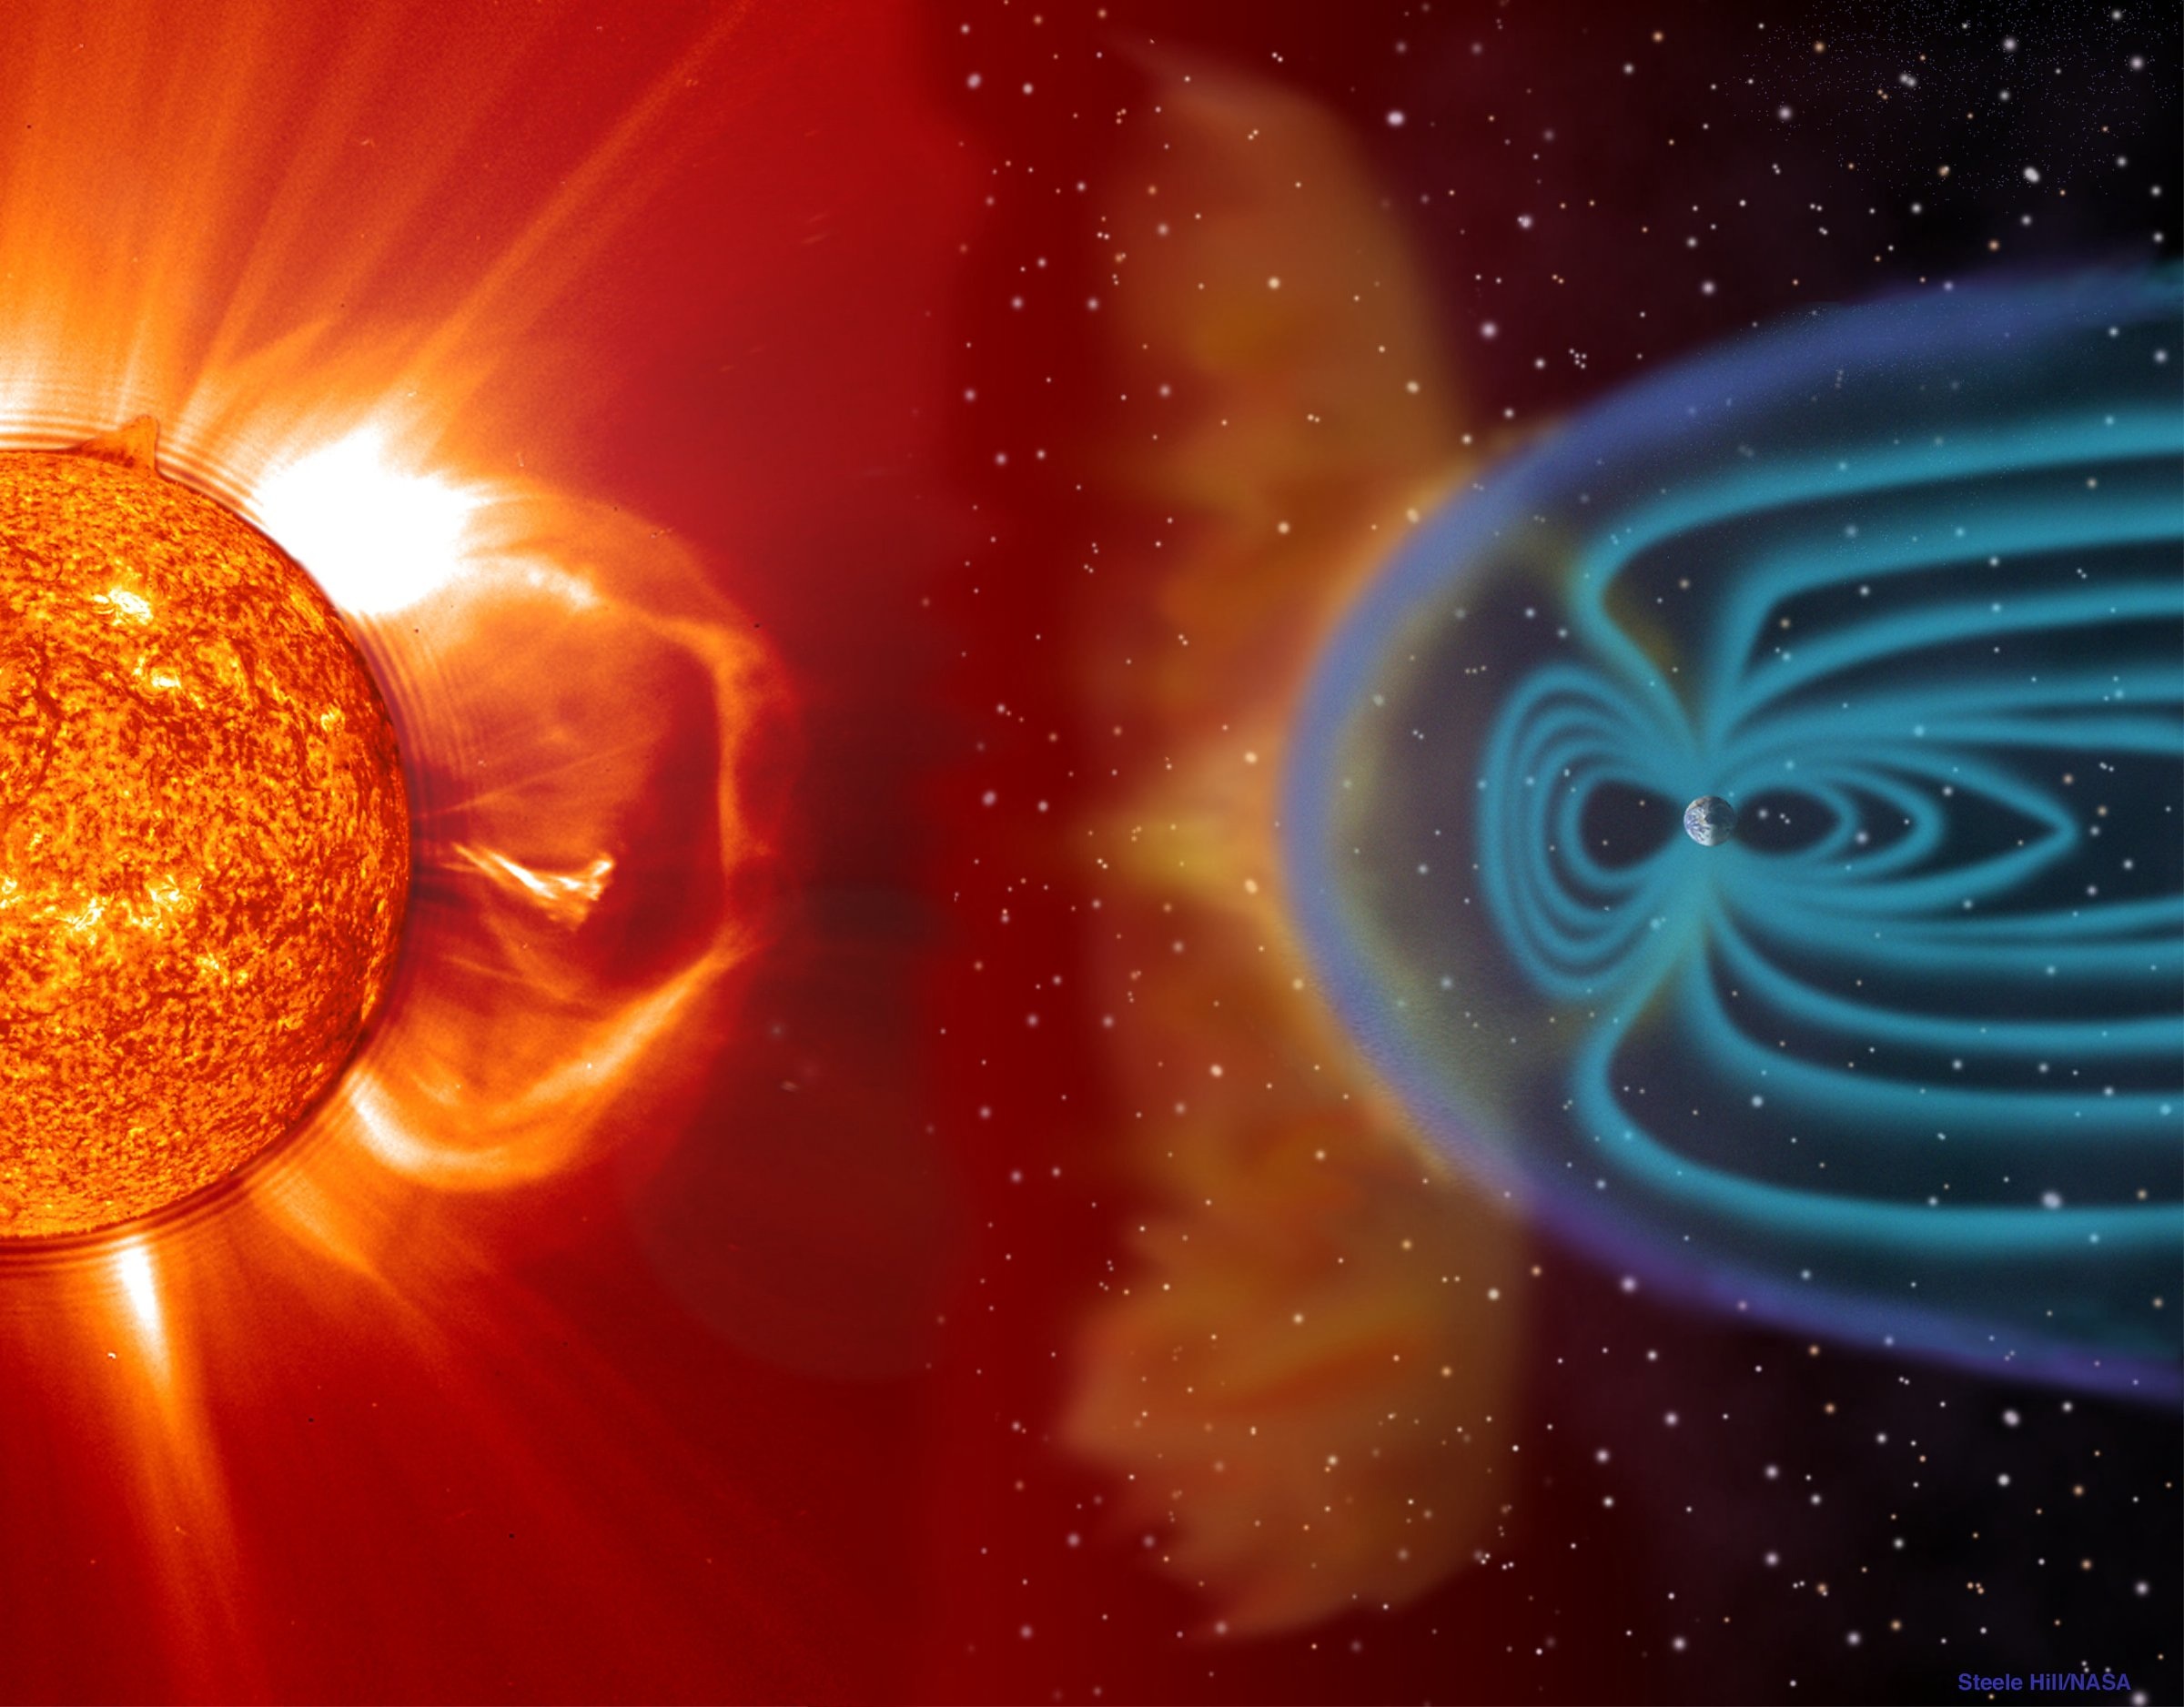
As inhabitants of Earth, our lives are dominated by weather. Not just in the form of rain and snow from atmospheric clouds, but also a sea of charged particles and magnetic fields generated by a star sitting 93 million miles away—our Sun. This phenomenon is called solar wind.
When strong magnetic storms occur on the Sun, tons of highly energetic particles are released into the solar wind. If these particles were free to hit the Earth, the radiation would cause life-threatening damage to our DNA, debilitate power grids, disrupt communications networks and damage electronic devices. Fortunately for us, the Earth’s magnetic dipole field and magnetosphere act as an invisible shield barring these particles from plummeting through the atmosphere.
However, this magnetic shield is not perfect. And during particularly intense solar storms the magnetosphere can “crack,” allowing charged particles to seep in and wreak havoc on the Earth’s technological infrastructure—an event called space weather. Scientists currently do not have the ability to accurately predict the severity of a space weather event or where it will have the most impact. But a team of researchers led by University of California, San Diego’s (UCSD’s) Homa Karimabadi is hoping to change that.
“One of the challenges in developing accurate predictive forecasts is that the solar wind is turbulent, and the details of turbulence are not well understood,” says Karimabadi, who heads the space plasma simulation group at UCSD.
Because turbulence in the solar wind occurs on widely different scales of physics—from planet-size to the sub-atomic—it is especially difficult to study. But using supercomputers at the National Institute of Computational Sciences (NICS), Karimabadi and his colleagues managed to simulate all the scales of solar wind turbulence at once—for the first time ever.
To make sense of this massive dataset, they tapped Lawrence Berkeley National Laboratory (Berkeley Lab) Visualization Specialist Burlen Loring, who developed custom analysis tools using supercomputers at the National Energy Research Scientific Computing Center (NERSC). Loring’s work allows researchers to study turbulence in unprecedented detail, and the results may hold clues about some of the processes that lead to destructive space weather events. This work was published in Physics of Plasmas.
“Partnering with the [visualization] group at Berkeley Lab has been critical in developing tools to analyze our data sets,” says Karimabadi. “There is an urgent need to develop accurate forecasting models; a severe space-weather event can have dire financial and national security consequences.”
Dangers of Space Weather and Our Imperfect Shield
Solar storms unleash bursts of radiation that can reach crew and passengers on commercial flights at certain altitudes and latitudes. Eventually the system could be used to log radiation exposure over longer periods of time for pilots and flight crews. Image Credit: NASA
The Sun is constantly blasting solar wind into space. As this wind blows across the solar system, sometimes at speeds more than one million miles per hour, it engulfs all planets (like Earth) in its path, but it isn’t our only threat.
Explosive storms on the Sun’s surface—called solar flares—can also blast charged particles—called plasma—into space with energy equivalent to 10 million volcanic eruptions. Occasionally, the Sun emits enormous outbursts—called coronal mass ejections (CMEs)—that can send up to 10 billion tons of plasma surging into our solar system. These blasts can produce an extreme space-weather event or even trigger geomagnetic storms. In 1989 a severe geomagnetic storm left millions of people in Quebec without power for more than nine hours.
Our only protection from these explosive events is the Earth’s magnetic field, which creates a “bubble” (the magnetosphere) that deflects the solar wind. Although most charged particles don’t easily cross the Earth’s magnetic field lines, some do penetrate this shield by a process calledmagnetic reconnection. This occurs when a magnetic field embedded in solar wind points in the opposite direction of Earth’s magnetic field. The opposing field lines connect in an explosive process that allows charged particles to reach Earth.
Particles traveling at high enough speeds along Earth’s magnetic field lines can also penetrate the magnetosphere and enter our atmosphere via the north and south poles. When the infiltrating particles interact with atmospheric nitrogen and oxygen, they create the Aurorae—northern and southern lights.
Today, scientists use a number of tools to measure solar activities. “We send satellites into space to take a lot of different measurements in the solar wind,” says Karimabadi. “One would expect plasma to cool off as it leaves the Sun and travels across the solar system, but satellite observations show that this is not the case—something heats it up along the way.”
Because satellites also reveal significant amounts of turbulence in solar wind, many scientists suspect that a “cascade of turbulence” generates the heat. But until Karimabadi’s simulations and Loring’s visualizations, it was not possible to identify the dissipation physics down to the smallest electron scales.
Simulations Capture ‘Cascade of Turbulence’
With help from Berkeley Lab visualization experts, astrophyscists found that as the turbulence evolves, it is actually creating waves that launch into the ambient plasma. (Image by Burlen Loring, Berkeley Lab)
Turbulence is a very common feature in the universe, and it occurs in many different forms. Most people are familiar with turbulence that cause bumpy airplane rides, but it is also the phenomenon that allows fluids to mix efficiently.
“As you stir your coffee, you are creating turbulence that allows the cream and coffee to mix right away. Without turbulence, it would take days for these ingredients to combine,” says Karimabadi. “Turbulence also occurs in the solar wind and the magnetosphere. Until recently, we didn’t have the tools to understand the causes and consequences of these processes. This makes it difficult for us to predict the intensity of space weather events or where it would have the most impact.”
The “cascade of turbulence” is a phenomenon common in fluid dynamics—turbulent energy injected at large eddies is transported to successively smaller scales until it is dissipated as heat. “As you can imagine, it is a huge challenge to solve this problem numerically, especially for solar wind because it involves so many scales. To put it in perspective, imagine having to resolve spatial scales larger than the Earth down to tiny electron scales,” says Karimabadi. “It requires a lot of computing power.”
Visualizing this data for analysis also proved to be a challenging task—one that required Loring to develop a number of new computational techniques. First he created tools to filter out the “noise” in the datasets. Then he produced new algorithms that allowed an existing visualization tool, called LIC, to run in parallel. By optimizing LIC to take advantage of massively parallel machines, Loring was able to speed up the visualization of these datasets, improve their aesthetic properties and allow researchers to interact with the visual in real-time. These tools are being widely distributed to the public via the Department of Energy’s (DOE’s) SciDAC Scalable Data Management, Analysis, and Visualization (SDAV) Institute.

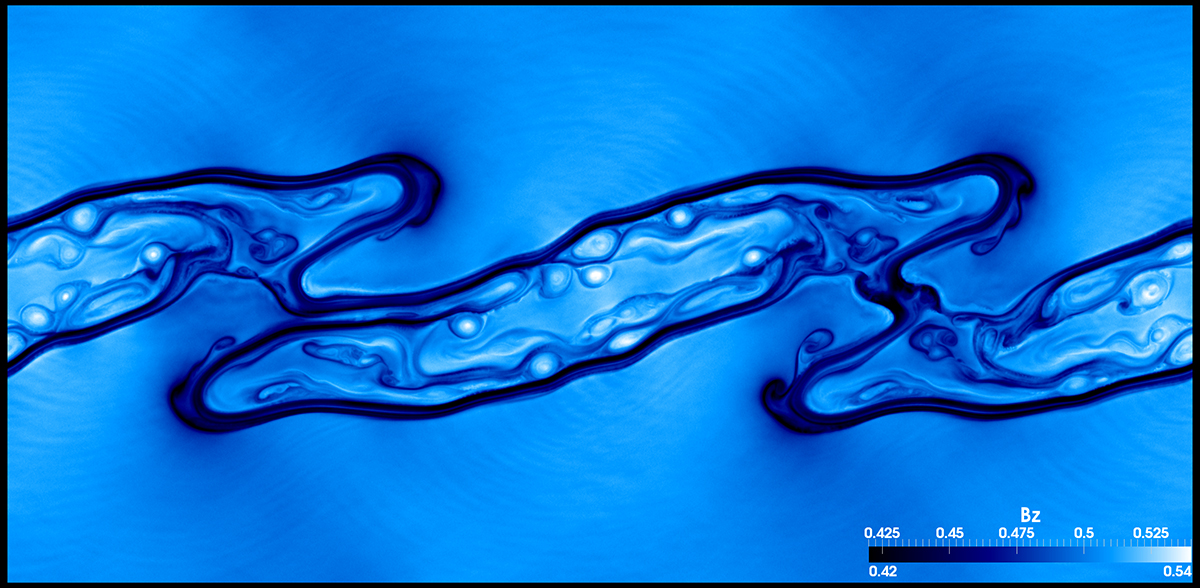
This LIC visualization of the magnetic field shows the hierarchical development of coherent structures in formation of current sheets and magnetic islands in fully developed turbulence. This level of detail is very difficult, if not impossible, to visualize using standard techniques of showing streamlines. Karimabadi and his colleagues are now using LIC routinely to search for development of complex structures. (Image by Burlen Loring, Berkeley Lab)
“For the first time we were able to visualize the current sheet in the solar wind, watch it form and evolve throughout its lifecycle,” says Loring. “A current sheet is a region in the plasma where magnetic energy is stored and subsequently released.”
The visualizations also revealed some unexpected wave features that the researchers intend to study further. “We noticed that as the turbulence evolves, it is actually creating waves that launch into the ambient plasma. Nobody had ever predicted these waves before,” says Karimabadi. “These simulations opened up a whole new area of physics for us. For the first time, we got a glimpse of multi-scale physics in the solar wind and could watch the cascade of turbulence. Now everyone in the field is recognizing the benefit of this kind of simulation.”
Loring used NERSC’s Edison to optimize LIC and generate visuals of Karimabadi’s datasets. He notes that high-speed networks like the DOE’s ESnet (Energy Sciences Network) were crucial to having interactivity with the visualization. In fact, it was this interactivity that allowed the researchers to discover and study the unexpected wave features.
“When you are rendering these datasets, you have to change the parameters to bring out real features, and network speed is really important to having that kind of interactivity with the visualization,” says Loring.
“This work is a major accomplishment, but there are still a lot of unknown physics in the solar wind to explore,” says Karimabadi. “There are many different drivers in the solar wind that can lead to turbulence, and we want to understand how those drivers affect the plasma structure and heat dissipation. We also want to work closely with experimentalists to refine our simulations.”
Aside from the simulation and visualization challenges, Karimabadi and his colleagues also face obstacles when it comes to extracting interesting and useful information from their massive scientific datasets. To develop computational tools and strategies for overcoming these hurdles, they’ve joined forces with the DOE-funded ExaHDF5 team, which is led by Berkeley Lab Computational Scientist Prabhat. For more about this collaboration read Sifting Through a Trillion Electrons.
About Berkeley Lab
Founded in 1931 on the belief that the biggest scientific challenges are best addressed by teams, Lawrence Berkeley National Laboratory and its scientists have been recognized with 16 Nobel Prizes. Today, Berkeley Lab researchers develop sustainable energy and environmental solutions, create useful new materials, advance the frontiers of computing, and probe the mysteries of life, matter, and the universe. Scientists from around the world rely on the Lab’s facilities for their own discovery science. Berkeley Lab is a multiprogram national laboratory, managed by the University of California for the U.S. Department of Energy’s Office of Science.
DOE’s Office of Science is the single largest supporter of basic research in the physical sciences in the United States, and is working to address some of the most pressing challenges of our time. For more information, please visit energy.gov/science.